A photocatalyst
Abstract
A process for synthesising visible light active high temperature stable anatase phase undped titanium dioxide photocatalyst and anti-microbial agent comprising the step of reacting hydrated titanium dioxide and hydrogen peroxide in an aqueous solution to form a sol. The titanium dioxide may be anatase stable to at least 900 degrees C. The titanium dioxide may be anatase stable to about 1000 degrees C. A visible light active dopant free anatase phase titanium dioxide that is stable up to about 900 degree C such as up to about 1000 degree C is also described. <Figure 3>
Term
No projected expiry on record.
- Priority
- Filed
- Published
- Today
22 claims: 14 independent, 8 dependent
- 1Claims 1. Λ process for synthesising visible light active high temperature stable anatase phase undoped titanium dioxide photoeatalyst comprising the step of reacting hydrated titanium dioxide with hydrogen peroxide in an aqueous solution to form a sol.
- 3A process as claimed in claim I or 2 wherein the titanium dioxide is anatase stable to about IOOO°C.
- 1113. A visible light active dopant free anatase phase titanium dioxide that is stable up to about WC.
- 1416. Λ visible light active dopant free anatase phase titanium dioxide that is stable up to about IOOOV. 20
- 2024. Use of a powder, film or coating as claimed in any one of claims 20 to 22 for water puri fi cat ion. 10
Independent claims14
194 paragraphs in 2 sections, as filed
A photoeatalyst”
- ·, II· mil I I ll,βι-τ,ββ» .η«Η>ιΜΐηΜ·ι··Μ
Introduction IE 0 9 0 9 1 4
The invention relates to a process for synthesising a high temperature stable titanium dioxide photoeatalyst fhe invention further relates to a high temperature stable anatase phase titanium dioxide and uses thereof
Titanium dioxide photoeatalyst exist in three phases; anatase. rutile and brookite. Among the three polymorphs, anatase exhibits highest photocatalytic activity. On heating, anatase and brookite irreversibly transform to the thermodynamically more stable rutile phase. Anatase to rutile transformation usually takes place at temperatures in the range of 500 - 700°C. Most of the ceramic processing technologies involve high temperature treatment and under these conditions anatase phase titanium dioxide transforms into the less photoactive rutile phase. Doping titanium dioxide with metals and non-metals stabilizes the anatase phase at higher temperatures, however the addition of dopants leads to the formation of secondary phases which have decreased photocatalytic activity.
There is a need for a high temperature photoeatalyst with improved photocatalytic activity. j w»Ki λ kb suie 23 JHL Η·Λ!£ί£~. of Tfafe*
Statements of Invention
According to the present invention there is provided a process for synthesising visible light active high temperature stable anatase phase undoped titanium dioxide photoeatalyst comprising the step of reacting hydrated titanium dioxide with hydrogen peroxide in an aqueous solution to form a sol.
The titanium dioxide may be anatase stable to at least 900°C. The titanium dioxide may be anatase stable to about 1000°C. The molar ratio of titanium dioxide to hydrogen peroxide may be about 1:16. The process may be performed at a temperature between about -20 and about 100°C. The process may be performed at about room temperature. The process may be performed al a pH of between about 5 to about 8. The process may be performed at a pH of about 7. The process may further comprise the step of heating the sol to form a gel. The sol may be heated to a temperature of up to about 1000°C. The process may further comprise the step of
-2IE 0 909 14 drying lhe gel to Idrm a powder. The gel may be dried at a temperature of about 100°C. I'he invention also provides a visible light active dopant free anatase phase titanium dioxide that is stable up to about 900°C, the titanium dioxide may be 100% anatase phase. The titanium dioxide may Have a band gap of about 2.82 eV.
The invention also provides a visible light active dopant free anatase phase titanium dioxide that is stable up to about IO00°C. The titanium dioxide may be about 5% anatase phase.
l he titanium dioxide may be hydrogen peroxide modified. The molar ratio of titanium dioxide to hydrogen peroxide may be about 1:16.
lhe invention iurther provides a powder, film or coating comprising titanium dioxide synthesised by the process as described herein or a visible light active dopant free anatase phase titanium dioxide as described herein. The powder, film or coating may be antimicrobial. The powder, film or coating may be self cleaning
I'he invention also provides an article comprising a powder, film or coating as described herein.
The invention also provides for the use of a powder, film or coating as described herein for water purification.
l he invention further provides for the use of a visible light active dopant free anatase phase titanium dioxide as described herein as an antimicrobial agent.
fhe invention further sill provides for the use of a visible light active dopant free anatase phase titanium dioxide as described herein for air purification.
Described herein is a process for synthesising undoped high temperature stable anatase phase titanium dioxide comprising the step of reacting hydrated titanium dioxide with hydrogen peroxide. The high temperature stable anatase phase titanium dioxide may be a visible light active photoeatalyst. The titanium dioxide may be 100% anatase stable at at least 600°C, The titanium dioxide may be 100% anatase stable at at least 800°C, The titanium dioxide may be 100% anatase stable at at least 900°C. The titanium dioxide may be 5% anatase stable at at least 1000 °C. The molar ratio of titanium dioxide to hydrogen peroxide may be between about 1:0.01
-3/£ 0 90 9 1 4 and 1:100. lhe molar ratio oi titanium dioxide to hydrogen peroxide may be between about 1:0.1 and 1:60. The molar ratio of titanium dioxide to hydrogen peroxide may be between 1:1 and 1:40. I'he molar ratio of titanium dioxide to hydrogen peroxide may be between 1:4 and 1:20. The molar ratio of titanium dioxide to hydrogen peroxide may be about 1:16.
I'he process may be performed at a temperature between about -50° to 150 °C such as between about -25° to 100 °C or between about -20° to 20 °C, for example between about-10° to 30 °C.
I'he sol may comprise an excess of up to 5000 molar times water. The sol may comprise an excess of up to about 1000 molar times water.
fhe process may further comprise the step of heating the sol to form a gel then a xerogel. The sol or xerogel may be heated to a temperature of about 400 °C. The sol or xerogel may be heated to a temperature of about 500 °C. The sol or xerogel may be heated to a temperature of about 600 °C. fhe sol or xerogel may be heated to a temperature of about 800 °C. The sol or xerogel may be heated to a temperature of about 900 °C. The sol or xerogel may be heated to a temperature of about 1000 °C. The sol or xerogel may be heated to a temperature of about 1200 °C.
The process may further comprise the step of drying the sol or gel or xerogel to form a film or a powder. The sol or gel or xerogel may be dried at a temperature range of 100 °C to 1400 °C.
Also described is an anatase phase undoped titanium dioxide photoeatalyst which has a band gap of less than about 3.15 eV at a temperature range of 100 to 1400 °C. The high temperature stable photoeatalyst may comprise hydrogen peroxide modified titanium dioxide. The high temperature stable photoeatalyst may comprise a molar ratio of titanium dioxide to hydrogen peroxide of between about 1:0.01 and about 1:100 such as between about 1:0.01 and 1:100. for example between about 1:0.1 and 1:60 or between 1:1 and 1:40 or between 1:4 and 1:20 such as about 1:16. The high temperature stable photoeatalyst may be a visible light active photoeatalyst.
The titanium dioxide may be in a stable anatase phase formed at a temperature of at least I00°C. The titanium dioxide may contain the anatase phase at a temperature of about 1400°C. The titanium dioxide may have less oxygen vacancy at higher temperature.
-4/£ 0 9 0 9 1 4
Also described is a coating, powder or additive comprising a photoeatalyst synthesised by the process described herein.
The photoeatalyst described herein may have applications in: an antimicrobial agent, selfcleaning properties, water purification, air purification, hygiene and food preservations.
fhe photoeatalyst may be in the form of a powder. The photoeatalyst may be in the form of a coating. The photoeatalyst may be in the form of a thin film or thick film. The photoeatalyst may be in the form of an additive.
Also described is a high temperature stable (up to 1000 °C) anatase phase titanium dioxide prepared by the modification of amorphous titanium dioxide with various amount of hydrogen peroxide (up to 1:16) followed by heat treatment. The hydrogen peroxide modified titanium dioxide photoeatalyst prepared through peroxo method may have a low band gap compared to the control sample. The visible light active titanium dioxide photoeatalyst prepared through the peroxo method may contain less oxygen vacancies compared to control samples, fhe titanium dioxide photoeatalyst prepared through the peroxo method may have slow electron hole recombination rate compared to the control sample.
Titania photoeatalyst prepared through the peroxo method may have stronger Ti-O-Ti bonds compared to the control sample.
Also described is a visible light active pure anatase or anatase rutile composite titania photoeatalyst.
We describe a process for synthesising high temperature stable anatase phase titanium dioxide comprising the step of reacting hydrated titanium dioxide with hydrogen peroxide in an aqueous solution lo form a sol.
The titanium dioxide may be anatase stable to at least 800°C.
The molar ratio of titanium dioxide to hydrogen peroxide may be between about 1:2 and about 1:16. The molar ratio of titanium dioxide to hydrogen peroxide may be about 1:16.
-5IE ο 9 Ο 9 1 4
The process may be performed at room temperature. The process may be performed at a pH of about 7.
The sol may comprise an excess of up to about 100 molar times water.
The process may further comprise the step of heating the sol to form a gel. The sol may be heated lo a temperature of about 900 °C.
The process may further comprise the step of drying the gel to form a powder, fhe gel may be dried at a temperature of about 100°C.
Also described is an anatase phase undoped titanium dioxide photoeatalyst which has a band gap of less than 3.15 eV at 600°C. The high temperature stable photoeatalyst comprise hydrogen peroxide modified titanium dioxide. The molar ratio of titanium dioxide to hydrogen peroxide may be between about 1:2 and about 1:16. The molar ratio of titanium dioxide may be about 1:16.
The titanium dioxide is in a stable anatase phase at a temperature of at least 500°C. Ihe titanium dioxide may be in a stable anatase phase al a temperature of up to about 1000°C.
Also described is a coating comprising a photoeatalyst synthesised by the process described herein.
The coating may be an antimicrobial coating. The coating may be a self cleaning coating.
Also described is an article comprising a coating as described herein.
Some of the advantages associated with the process described herein include:
♦ Environmentally friendly: the process uses water as a solvent, whereas the conventional sol - gel process use alcohol as solvent and use acids or bases and other stabilising agents for the synthesis of sol.
IE 0 9 0 9 1 4
-6• l’he process is suitable for scale up for large batch production making the process a commercially and industrially viable process. The conventional sol - gel processes have limitations for scale up.
• fhe process forms high temperature stable anatase titanium dioxide that can be used lo form thin coatings, the conventional sol - gel process forms thermally less stable thick coatings.
• l’he process forms high temperature stable undoped anatase phase titania dioxide with high purity. Conventional metal and non metal doped titania form secondary phases at high temperature which results in reduced photocatalytic activity.
• The high temperature stability of the titanium dioxide photocatalvst can be controlled by adjusting the amount of hydrogen peroxide present in the process. In conventional sol - gel process and i or metal non-metal doping, there arc limitations for the maximum amount of dopant that can be added.
• The anatase phase of the titanium dioxide can be tuned by using various ratios of hydrogen peroxide, for example 100 % anatase phase titanium dioxide is obtained al 900°C as a result of hydrogen peroxide modification (without any doping) of the titanium dioxide.
• l'he process forms a dopant free high temperature stable (100% anatase phase up to 900<sup>o</sup>C) and visible light active titanium dioxide.
• The process forms a transparent sprayable sol or a powder or a dispersion and high temperature stable titanium dioxide. The titanium dioxide is photocatalytically active up to temperature of about 1000°C.
• fhe process synthesises high temperature stable anatase phase titanium dioxide by insitu generation of oxygen from hydrogen peroxide. The band gap can be controlled by adjusting the ratio of titanium dioxide precursor to hydrogen peroxide.
ΙΕ ο 9 Ο 9 1 4
-7• The titanium dioxide photoeatalyst formed by the process has very low photo emission.
• High temperature stable anatase phase titanium dioxide is formed without the formation of any composite secondary phases.
• I'he process forms a sprayable sol of high temperature stable anatase phase titanium dioxide. The sprayable sol is stable up to at least 6 months. The solution phase synthesis results in the formation of a sol that provides a uniform and homogeneous coating, • I'he process is a high yield process with a yield of about 88%.
Brief Description of the Drawings
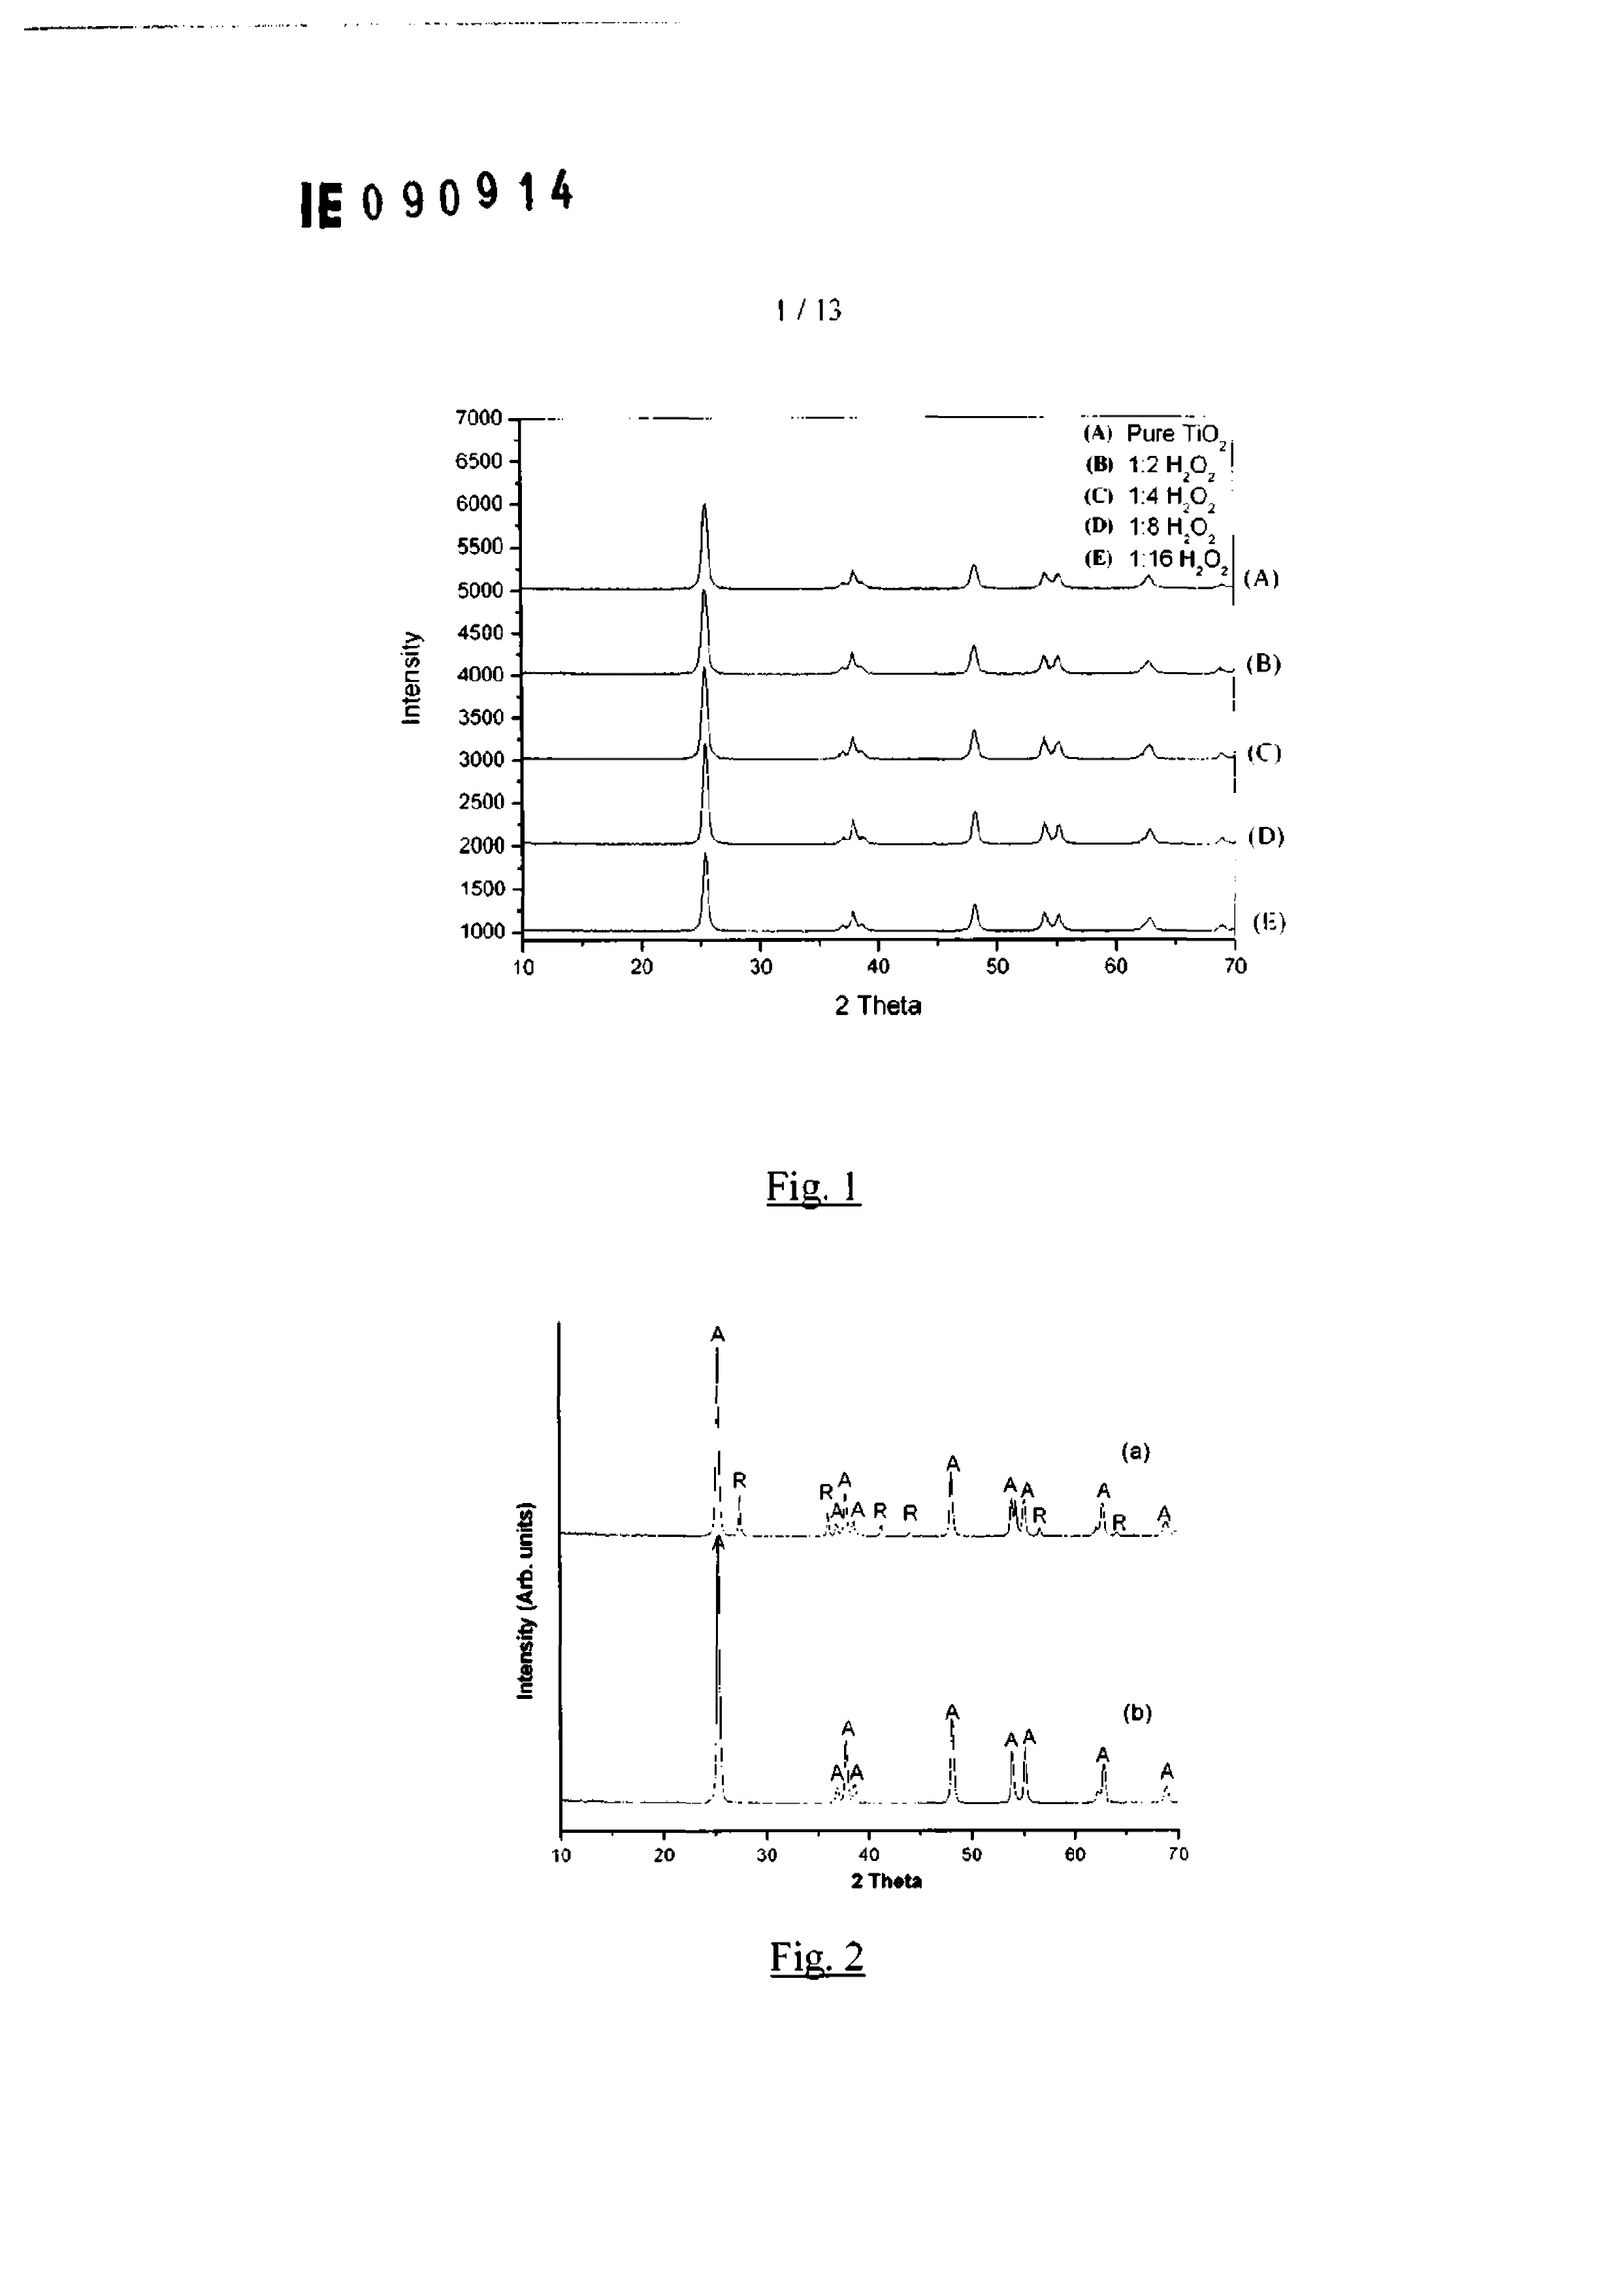
The invention will be more clearly understood from the following description of an embodiment thereof given by way of example only, with reference to the accompanying drawings, in which:Eig. I is a trace showing the X-ray diffraction patterns of pure titanium dioxide and hydrogen peroxide modified titanium dioxide samples calcined at 600°C;
Eig. 2 is a trace showing the X-ray diffraction pattern of pure titanium dioxide (a) and 1:2 hydrogen peroxide modified titanium dioxide (b) samples calcined at 800°C. (A = anatase and R = rutile);
Eig. 3 is a trace showing the X-ray diffraction pattern of pure titanium dioxide (a) and 1:16 hydrogen peroxide modified titanium dioxide (b) samples calcined at 900°C (A = anatase and R = rutile);
Eig. 4 is a trace showing the X-ray diffraction pattern of pure titanium dioxide (a) and 1:16 hydrogen peroxide modified titanium dioxide (b) samples calcined at 1000°C;
Eig. 5 is a Raman spectra of pure titanium dioxide (a) and 1:2 hydrogen peroxide modified titanium dioxide (b) samples calcined at 800°C (A = anatase and R = rutile);
IE Ο 9 0 9 1 4
-8Fig. 6 is a Raman spectra of pure titanium dioxide (a) and 1:16 hydrogen peroxide modified titanium dioxide (b) samples calcined at 900°C (A = anatase and R = rutile);
Fig. 7 is a photoluminescence spectra of pure titanium dioxide (a) and 1:16 hydrogen 5 peroxide modified titanium dioxide (b) samples calcined at 600°C;
l ig. 8 is a photoluminescence spectra of pure titanium dioxide (a) and 1:16 hydrogen peroxide modified titanium dioxide (b) samples calcined at 700°C:
Fig. 9 is a photoluminescence spectra of pure titanium dioxide (a) and 1:16 hydrogen peroxide modified titanium dioxide (b) samples calcined at 900°C;
Fig. 10 is a photoluminescence spectra of 1:16 hydrogen peroxide modified titanium dioxide samples calcined at 600°C (a), 700°C (b), 800°C (c) and 900°C (d);
Fig. 11 is a photoluminescence spectra of pure titanium dioxide samples calcined at 600°C (A). 700°C (B), 800°C (C) and 900°C (D);
Fig. 12 is a UV - visible absorption spectra of pure and hydrogen peroxide modified 20 titanium dioxide samples calcined at 600°C;
Fig. 13 is a UV - visible absorption spectra of pure and hydrogen peroxide modified titanium dioxide samples calcined at 700°C;
Fig. 14 is a UV - visible absorption spectra of pure and hydrogen peroxide modified titanium dioxide samples calcined at 800°C;
Fig. 15 is a UV - visible absorption spectra of pure and hydrogen peroxide modified titanium dioxide samples calcined al 900°C;
Fig. 16 is a FT-IR spectrum of titanium dioxide prepared through the peroxo titania method described herein (A) and a control sample (B), both samples were calcined at 600 °C:
-9Fig. 17 is a graph showing the rates of visible light photocatalysis of a hydrogen peroxide modified titanium dioxide sample and a commercially available Degussa P-25 photoeatalyst (Degussa P-25 photoeatalyst comprises 75% anatase phase titanium dioxide and 25% rutile phase titanium dioxide);
Fig. 18 (A) is a photograph of a spray coating process for a tile and (B) is a photograph of a tile that has been coated with a photoeatalyst;
Fig. 19 is a photograph of a piece of glass that has been dip coated in a photoeatalyst;
Fig. 20 is a photograph of a door handle that has been dip coated in a photoeatalyst.
Fig. 21 is a UV-visible absorption spectra of methylene blue decanted into a non-eoated glass bottle (A) and a hydrogen peroxide modified titania sol coated glass bottle (B) prior to light irradiation;
Fig. 22 is a UV-visible absorption spectra of methylene blue in the bottles of Fig. 21 following 3 hours of light irradiation in which (A) is the non-coated glass bottle and (B) is the hydrogen peroxide modified titania sol coated glass bottle;
Fig, 23 is a photograph of an agar plate on which Staphylococcus aureus were grown in the presence of (A) 1:16 T1O2: H2O2 coated tile calcined at 900 °C and (B) uncoated tile; and
Figure 24 is a photograph of an agar plate on which Methicillin-resistant Staphylococcus aureus were grown in the presence of (A) an uncoated tile and (B) 1:16 fiCl· : H2O2 coated tile calcined at 900 °C.
Detailed Description
We describe a process for synthesising high temperature stable titanium dioxide through a peroxo titania route. In the process, hydrated titanium dioxide reacts with various molar ratios of hydrogen peroxide to form peroxo titanium complex in an excess of water (up to 100 mole limes). Ihe resultant sol is transparent and sprayable and upon heat treatment forms anatase
-10IE 0 9 0 9 1 4 phase titanium dioxide. Titanium dioxide prepared through this process is pure (non-doped) and anatase phase stable at high temperatures. Hydrogen peroxide modified titania shows high temperature anatase phase stability. A gradual increase in anatase phase stability was observed with an increase in the amount of hydrogen peroxide used in the process. The composition 1:16 T102 : IhO? shows 100% anatase even at 900°C whereas unmodified titania is 100% rutile at 900°C. Titanium dioxide prepared through this process shows improved visible light photocatalytic activity when compared to the commercially available Degussa P-25 standard photoeatalyst which comprises 75% anatase phase titanium dioxide and 25% rutile phase titanium dioxide.
The process can be used to synthesise high temperature stable titanium dioxide nano powder, high temperature stable titania thin and thick films, and high temperature stable humidity oxygen sensors.
The invention will be more clearly understood from the following examples.
Examples
Example 1 - Synthesis of hydrogen peroxide modified titanium dioxide
Hydrogen peroxide modified titanium dioxide was prepared by a reaction between hydrated titanium dioxide and 30 vol% hydrogen peroxide. The molar ratio between hydrated titanium dioxide and hydrogen peroxide was varied at 1:0, 1:2, 1:4, 1:8 and 1:16 titanium dioxide : hydrogen peroxide.
In a typical synthesis, 5.5 ml of titanium tetra chloride was added to water to form titanium oxychloride. 15 ml ammonium hydroxide was added slowly to the titania precursor solution to precipitate hydrated titanium dioxide. The precipitated hydrated titanium dioxide was washed with water to free chloride ions. The precipitate obtained was then treated with 250 ml water and different amounts of 30 vol % hydrogen peroxide to form an orange coloured transparent solution. This solution on heating undergoes gelation. The gel obtained was dried at 100 °C and the xerogel obtained was calcined at 600, 700, 800, 900 and 1000 °C.
A yield of about 88 % was observed for the synthesis process.
ΙΕ ο 9 Ο 9 1 4
- 11 Example 2 - Physical properties of hydrogen peroxide modified titanium dioxide
High tenweruiure Mobility
Anatase to rutile transformation in an unmodified titania occurs at 500-700 °C. Hydrogen peroxide modi lied titania exhibits anatase to rutile transformation at a much higher temperature. As the amount of H2O2 increases the transformation temperature of the hydrogen peroxide modi tied titanium dioxide also increases. All samples calcined at 600°C and 700°C show 100% anatase phase (Fig. 1). Unmodified sample shows 30% rutile phase at 800°C whereas the sample 1:2 TiO>: H2O2 was completely anatase (Fig. 2). 100 % rutile phase was observed in unmodified sample calcined at 900°C whereas 1:16 TiO<sub>2</sub> : H2O2 shows 100% anatase (Fig. 3). Samples 1:8 T1O2 : H2O2 and 1:16 TiCb : H2O2 contains 5 % anatase phase even after calcinations at 1000°C (Fig, 4). All other samples were 100% rutile.
Results obtained from X-ray diffraction (XRD) were confirmed using laser Raman spectroscopy. The Raman active modes for anatase, Alg+2Blg+3Eg at 147, 197, 396, 515 and 638 cm-L and rutile. Alg+B1g+B2g+Eg at 144, 238, 447 and 611 cm-1 were used as fingerprints. All samples calcined at 600 and 70O°C showed 100% anatase phase. Control sample (non-modified titanium dioxide) calcined al 800°C shows a peak characteristic of rutile at 447 cm*<sup>1</sup> and a shoulder at the anatase peak corresponding to a Raman shift of 611cm<sup>1</sup> (Fig. 5). Control sample calcined at 900°C shows main peaks at 611, 447, 238. and a less intense peak at 144 cm<sup>-1</sup> (Fig. 6). Peaks of pure anatase were observed for the modified sample 1:16 H2O2 at 147, 197, 396. 515 and 638 cm Thus results observed from X-Ray diffraction studies were confirmed using laser Raman spectroscopy.
Low intensity Thai (luminescence
Phololumincscencc spectroscopy is a powerful tool for analyzing the surface defects and energy levels of luminescent nanoparticles. Wavelength values in the emission spectrum obtained were converted in to band gap values in electron volt according to equation eV= 1239.8/λ. Luminescence emission spectra of unmodified sample shows peaks at 3.2 eV and 3eV both corresponding to indirect electronic transitions. All H2O2 modified samples calcined at 600°C shows less intense bands at 3 and 3.2 eV. In the control sample intensity of 3.2 eV peak was higher than that of 3 eV peak. Band observed at 2.59 eV for unmodified sample corresponds to oxygen vacancy. Oxygen vacancies can act as electron hole recombination sites. This may be the reason for high intensity peak for unmodified sample. All modified samples shows less intense
-12IE 0 9 0 9 1 4 peaks at 3.2 and 3eV. Intensity of 3 eV peak was high in all modified samples compared to 3.2 eV peak. Band corresponding to oxygen vacancy was less intense in H<sub>2</sub>O<sub>2</sub> modified samples. Less oxygen vacancy may be the reason for less intense luminescent peaks of modified samples. Unmodified sample calcined at 900°C shows a 3eV peak corresponding to rutile and another peak at 3.69 indicating direct transition. 1:16 TiO<sub>2</sub> : H<sub>2</sub>O<sub>2</sub> modified sample shows peaks characteristic of pure anatase (Fig. 9). Figs. 10 and 11 shows the effect of calcination temperature on the peak intensities of 1:16 TiO<sub>2</sub>: H<sub>2</sub>O<sub>2</sub> modified sample and unmodified sample respectively. It can be seen that the total intensity and the intensity of the 2 bands increases with calcination temperature and intensity of the peak at 2.59 eV also increases. This indicates an increase of oxygen vacancies with temperature. It is clear from Figs. 10 and 11 that 1:16 TiO<sub>2</sub> : H<sub>2</sub>O<sub>2</sub> modified sample contains less oxygen vacancies at all calcination temperatures compared to unmodified sample. Thus it is clear from the phospholuminescent spectra that H<sub>2</sub>O<sub>2</sub> modified samples contain less oxygen vacancies, which is the reason for the high temperature anatase stability of hydrogen peroxide modified titanium dioxide samples.
Lower band gun
Absorption spectrum of pure and H2O2 modified samples (Fig. 12 to 15) was recorded using Perkin Plmer Lambda 900 UV/VIS Spectrometer in the diffused reflectance mode. An increase in absorption wavelength indicates the band gap lowering of hydrogen peroxide modified samples. When calcined at 600°C, the control sample absorbs at 395 nm. which correspond to a band gap of 3.15 eV. As the amount of hydrogen peroxide increases, the absorption edge of the spectrum gradually shift to longer wavelength. The lowest band gap was obtained for 1:16 TiO<sub>2 </sub>:H<sub>2</sub>O<sub>2</sub> modified sample calcined at 600°C (Tabled), 700°C (Table 3), 800°C {'fable 5), and 900T (Table 7).
Tabic. 1 Absorption wavelength and band gap values of H<sub>2</sub>O<sub>2</sub> modified samples calcined at 600 °C
<td> Composition</td><td> Absorption wavelength (nm)</td><td> Band gap (eV)</td>
<td> Control</td><td> 394</td><td> 3.15</td>
<td> 1:2 fiO<sub>2</sub>: II<sub>2</sub>O<sub>2</sub></td><td> 397</td><td> 3.12</td>
<td> 1:4 TiO<sub>2</sub>: H<sub>2</sub>O<sub>2</sub></td><td> 399</td><td> 3.10</td>
<td> 1.8 TiO<sub>2</sub>: H<sub>2</sub>O<sub>2</sub></td><td> 402</td><td> 3.08</td>
<td> 1 16 TiO<sub>2</sub> : H<sub>2</sub>O<sub>2</sub></td><td> 409</td><td> 3.00</td>
Table 2. Composition of H<sub>2</sub>O<sub>2</sub> modified samples calcined at 600 °C
ΙΕ ο 90 9 1 4
<td> Composition</td><td> % of anatase</td><td> % of rutile</td>
<td> Control (Pure)</td><td> 100</td><td> 0</td>
<td> 1:2 Ti()<sub>2</sub>: H2O2</td><td> 100</td><td> 0</td>
<td> 1:4 l'iO<sub>2</sub>: H<sub>2</sub>O<sub>2</sub></td><td> 100</td><td> 0</td>
<td> 1:8 TiO<sub>2</sub>:H<sub>2</sub>O<sub>2</sub></td><td> 100</td><td> 0</td>
<td> 1:16 Ί iO<sub>2</sub>: H2O2</td><td> Ϊ00</td><td> 0</td>
Table 3. Band gap values of H<sub>2</sub>O<sub>2</sub> modified samples calcined at 700 °C
<td> Composition</td><td> Absorption wavelength (nm)</td><td> Band gap (eV)</td>
<td> Control (Pure)</td><td> 400</td><td> 3.10</td>
<td> 1:2 TiO<sub>2</sub>: II2O2</td><td> 407</td><td> 3.04</td>
<td> 1:4 TiO?: H2O2</td><td> 415</td><td> 2.98</td>
<td> 1:8 TiCT : H<sub>2</sub>O<sub>2</sub></td><td> 421</td><td> 2.94</td>
<td> l:16TiO<sub>2</sub>:H<sub>2</sub>O<sub>2</sub></td><td> 432</td><td> 2.86</td>
Table 4. Composition of H<sub>2</sub>O<sub>2</sub> modified samples calcined at 700 °C
<td> Composition</td><td> % of anatase</td><td> % of rutile</td>
<td> Control (Pure)</td><td> 100</td><td> 0</td>
<td> 1:2 ΤίΟ<sub>2</sub>:1Ι<sub>2</sub>Ο<sub>2</sub></td><td> 100</td><td> 0</td>
<td> 1:4 1 tO<sub>2</sub>: 11<sub>2</sub>O<sub>2</sub></td><td> 100</td><td> 0</td>
<td> 1:8 TiO<sub>2</sub>: II2O2</td><td> 100</td><td> 0</td>
<td> 1:16 TiO<sub>2</sub>: H<sub>2</sub>O<sub>2</sub></td><td> 100</td><td> 0</td>
l able 5. Band gap values of H2O2 modified samples calcined at 800 °C
<td> Composition</td><td> Absorption wavelength (nm)</td><td> Band gap (eV)</td>
<td> Control (Pure)</td><td> 419</td><td> 2.96</td>
<td> 1:2 TiCT : H<sub>2</sub>O<sub>2</sub></td><td> 416</td><td> 2.98</td>
<td> 1:4 1 iO<sub>2</sub>:11<sub>2</sub>O<sub>2</sub></td><td> 432 <sup>1</sup></td><td> 2.87</td>
<td> 1:8 Ti()<sub>2</sub>: H<sub>2</sub>O<sub>2</sub></td><td> 438</td><td> 2.83</td>
<td> 1:16 TiO<sub>2</sub> : H<sub>2</sub>O<sub>2</sub></td><td> 442</td><td> 2.80</td>
Table 6. Composition of H<sub>2</sub>O<sub>2</sub> modified samples calcined at 800 °C
Composition % of anatase % of rutile
IE Ο 9 Ο 9 1 4
<td> Control (Pure)</td><td> 78</td><td> 22</td>
<td> 1:2 TiO<sub>2</sub>:H<sub>2</sub>O2</td><td> 100</td><td> 0</td>
<td> 1:4 I iO<sub>2</sub> : H<sub>2</sub>O<sub>2</sub></td><td> 100</td><td> 0</td>
<td> 1:8 Ί iO<sub>2</sub> : H<sub>2</sub>O<sub>2</sub></td><td> 100</td><td> 0</td>
<td> 1:16 TiO<sub>2</sub>: H<sub>2</sub>O<sub>2</sub></td><td> 100</td><td> 0</td>
Table 7. Band gap values of H<sub>2</sub>O<sub>2</sub> modified samples calcined at 900 °C
<td> Composition</td><td> Absorption wavelength (nm)</td><td> Band gap (eV)</td>
<td> Control (Pure)</td><td> 424</td><td> 2.92</td>
<td> 1:2 TiO<sub>2</sub>: H<sub>2</sub>O<sub>2</sub></td><td> 421</td><td> 2.94</td>
<td> 1:4 TiO<sub>2</sub>: 1I<sub>2</sub>O<sub>2</sub></td><td> 434</td><td> 2.85</td>
<td> 1:8 TiO<sub>2</sub>: H<sub>2</sub>O<sub>2</sub></td><td> 438</td><td> 2.83</td>
<td> 1:16 TiO?: H<sub>2</sub>O<sub>2</sub></td><td> 440</td><td> 2.82</td>
fable 8. Composition of H2O2 modified samples calcined at 900 °C
<td> Composition</td><td> % of anatase</td><td> % of rutile</td>
<td> Control (Pure)</td><td> 0</td><td> 100</td>
<td> 1:2 ΊΊΟ; : H<sub>2</sub>O<sub>2</sub></td><td> 15</td><td> 85</td>
<td> 1:4 TiO? : Η<sub>2</sub>Ο<sub>2</sub></td><td> 58</td><td> 42</td>
<td> 1:8 TiO?: H<sub>2</sub>O<sub>2</sub></td><td> 79</td><td> 21</td>
<td> 1:16ΊΊΟ2 : H<sub>2</sub>O<sub>2</sub></td><td> 100</td><td> 0</td>
Table 9. Composition of H<sub>2</sub>O<sub>2</sub> modified samples calcined at 1000 °C
<td> Composition</td><td> % of anatase</td><td> % of rutile</td>
<td> Control (Pure)</td><td> 0</td><td> 100</td>
<td> 1:2 TiO<sub>2</sub>:H<sub>2</sub>O<sub>2</sub></td><td> 0</td><td> 100</td>
<td> 1:4 TiO?: H<sub>2</sub>O<sub>2</sub></td><td> 0</td><td> 100</td>
<td> 1:8 TiO?: H<sub>2</sub>O<sub>2</sub></td><td> 0</td><td> 100</td>
<td> 1:16 TiO<sub>2</sub>: H<sub>2</sub>O<sub>2</sub></td><td> 5%</td><td> 95%</td>
Stronger Ti-O-Ti bonds
FTIR spectra of the control and 1:16 titanium dioxide : hydrogen peroxide modified titania samples were recorded before and after calcination at 600°C. Referring to Fig. 16 the calcined samples shows a broad band at 500 cm'<sup>1</sup> which is characteristic of Ti-O-Ti stretching vibrations.
- 15Titania photoeatalyst prepared through peroxo method showed stronger Ti-O-Ti bonds (compared lo the control sample).
IE 0 909 14
Example 3 - Photocatalytic properties of hydrogen peroxide modified titanium dioxide.
In a typical visible light photo catalytic study, 0.06 g of titania powder was mixed with 50 ml methylene blue solution (1 <sup>x</sup>10'<sup>5</sup> M ). The suspension obtained was stirred in dark for 15 minutes. This was to ensure homogeneous mixing and to avoid any decrease in concentration of dye during the reaction as a result of adsorption. The suspension was then irradiated with visible light (450 nm) while stirring. Visible light was produced using a 450 nm cut oft' filter and a Q-Sun solar simulator. Degradation of the dye was monitored by withdrawing 5 ml aliquots at regular intervals. These aliquots were centrifuged and absorption spectra of the samples were recorded using a UV/Vis spectrometer. The rate of degradation was assumed to obey pseudo-first order kinetics. Rate constant for degradation, k, was calculated from the first order plot (Equation 1.1).
In
T=<sup>kt</sup> (1-1)
Where Ao is the initial absorbance, A is absorbance after a time (t) and k is the first order rate constant.
Referring to F ig. 17, hydrogen peroxide modified titanium dioxide exhibits visible light photocatalytic properties that are comparable to the photocatalytic properties of the commercially available Degussa P-25 photoeatalyst.
Example 4 - Photocatalytic coatings
Hydrated titanium dioxide reacts with hydrogen peroxide to form a peroxo complex. This complex exists as an orange coloured homogeneous solution. Therefore the precursor itself is a solution which can be used for coating applications. On heat treatment, this complex decomposes to form titanium dioxide photo catalyst.
I'he coatings were applied using dip and spray coating techniques. For dip coating (Figs. 19 and 20). downward movement of the glass was adjusted as 2mm per minute. The coated glass was then dried at 50°C. This results in a fine transparent coating on the glass surface. Coated glass slides were calcined at 400°C using a heating rate of 1°C.
-16IE 0 9 0 θ 1 4
Spray coaling were carried out in compressed air as carrier gas. Sprayer was kepi at 30 cm away from the samples (Fig. 18A). Sprayed samples were first dried at room temperature followed by high temperature treatment.
Example 5 - Photocatalytic coating of a glass bottle
Hydrogen peroxide modified titania sol was used for the fabrication of a photoactive antibacterial titania thin film coating inside glass bottles. In a typical experiment, glass bottles were filled with titania sol and decanted to form a thin film coating inside the bottle. Coated bottles were first dried at room temperature and then calcined at 600°C. Photocatalytic activity of the coalings was analysed using the methylene blue degradation technique. In a typical photocatalytic study. 50 ml of methylene blue solution (I x 10'<sup>5</sup> M) was dispensed into the hydrogen peroxide modified titania coated glass bottle. The bottle was irradiated with solar light using a Q-sun solar simulator, the light intensity was adjusted as 0.68 W/m<sup>2</sup>. Visible light was produced using a 450 nm cut off filter. A non-coated glass bottle was used as a control. Decomposition of methylene blue was observed using UV/VIS spectroscopy. Methylene blue in the hydrogen peroxide modified titania coated glass bottle become colourless after 3 hours of light irradiation, whereas methylene blue in the non-coated glass bottle remained coloured (Figs. 21 and 22). These observations indicate that hydrogen peroxide modified titania can be used as a photoactive antibacterial coating for glass bottles. The photocatalytic coating may be used to sterilise the contents of a bottle.
Example 6 - Antimicrobial study
Staph) 7 ococcus an re us
The antibacterial activity of the hydrogen peroxide modified titanium dioxide against Staphylococcus aureus (ATCC 259220) was determined using the following methodology. A stock culture of the bacterium was grown on overnight in nutrient rich broth PCA-3 w/v% tryptonc. I w/v% glucose, 2,5 w/v% yeast, 9 w/v% agar, Oxoid) to give a concentration of approximately 10* CFU/ml. Bacteria was diluted one in a hundred with maximum recovery diluent (MRD - lw/v% Peptone, 8.5w/v% NaCI, Oxoid) to give working cultures of approximately IO<sup>6</sup> CFU/ml. A tile sample coated with 1:16 T1O2 : H2O2 calcined at 900°C and an uncoated tile sample (225 cm<sup>2</sup>) were inoculated with 3 mis of the bacterial culture respectively and exposed to indoor light (fluorescent light from ceiling) for 6 hours. The samples were subsequently incubated at 37°C overnight. The samples were then agitated with MRD (50
IE ο 9 0 9 1 4
- 17mis) in sterile stomacher bags. To determine the number of organisms, the MRD was serially diluted tenfold and the resulting dilutions plated (ΙΟΟμΙ) onto plate count agar (PCA) for overnight incubation at 37°C. Samples and dilutions were performed in duplicate. Referring to Fig. 23. no growth of 5. aureus was observed with the hydrogen peroxide modified titanium dioxide (Fig. 23A) whereas growth was observed in the presence uncoated tile samples. This demonstrates that the hydrogen peroxide modified titanium dioxide is antibacterial.
Methicillin-resistant Staphylococcus aureus
The antibacterial activity of the hydrogen peroxide modified titanium dioxide against Methicillin-resistant Staphylococcus aureus (MRSA A TCC 43300) was determined using the following methodology. A stock culture of the bacterium was grown on overnight in nutrient rich broth (PCA-3 w/v% tryptone, 1 w/v% glucose, 2.5 w/v% yeast, 9 w/v% agar, Oxoid) to give a concentration of approximately 10<sup>s</sup> CFU/ml. Bacteria was diluted one in a hundred with maximum recovery diluent (MRD - lw/v% Peptone, 8.5w/v% NaCl, Oxoid) to give working cultures of approximately 10<sup>6</sup> CFU/ml. A tile sample coated with 1:16 TiO? : H2O2 calcined at 900°C and a uncoaled tile sample (225 cm<sup>2</sup>) were inoculated with 3 mis of the bacterial culture respectively and exposed to indoor light (tluorescent light from ceiling) for 6 hours. The samples w'ere subsequently incubated at 37°C overnight. The samples were then agitated with MRD (50 mis) in sterile stomacher bags. To determine the number of organisms, the MRD was serially diluted tenfold and the resulting dilutions plated (ΙΟΟμΙ) onto plate count agar (PCA) for overnight incubation at 37°C. Samples and dilutions were performed in duplicate. Referring to Fig, 24. no growth of MRSA was observed with the hydrogen peroxide modified titanium dioxide (Fig. 24B) whereas growth was observed in the presence uncoated tile samples (Fig. 24A). This demonstrates that the hydrogen peroxide modified titanium dioxide is antibacterial.
The invention is not limited to the embodiment hereinbefore described, with reference to the accompanying drawings, which may be varied in construction and detail.
Contents2
13 sheets
Sheet 1 Sheet 2 Sheet 3 Sheet 4 Sheet 5 Sheet 6 Sheet 7 Sheet 8 Sheet 9 Sheet 10 Sheet 11 Sheet 12 Sheet 13
3 members in 3 offices
Priority claims5
| Document | Office | Kind | Date |
|---|---|---|---|
| 20080967 | Ireland | A | |
| 20090914 | Ireland | A | |
| 20080967 | – | – | – |
| IE20080000967 | – | – | – |
| IE20090000914 | – | – | – |
Members3
| Document | Office | Kind | |
|---|---|---|---|
| WO2010064225A1 | World Intellectual Property Organization (WIPO) | A1 | |
| IE20090914A1This record | Ireland | A1 | |
| EP2370361A1 | European Patent Office (EPO) | A1 |
1 legal event, as the office reported them to INPADOC
Events
| Event | Code | |
|---|---|---|
| Patent lapsed through non-payment of renewal feeLapsedMM9A | MM9A |
Numbers
- Publication, DOCDB
- 20090914
- Publication, EPODOC
- IE20090914
- Application
- 914
- Application, DOCDB
- 20090914
- Application, EPODOC
- IE20090000914
Titles
- English
- A photocatalyst
Classification
- IPC, 2
- B01J35 00
- C01G23 00